“Aktien clustern”#
Wir importieren die Daten von sklearn.
Es handelt sich im Prinzip um Zeitreihen: Für eine Reihe von Aktienwerten sind die Eröffnungs- und Schlusskurse für jeden Handelstag vorhanden.
Wir betrachten die Variation pro Handelstag und versuchen, diejenigen Werte zusammenzufassen, die ähnlich variieren.
from sklearn import cluster, covariance, manifold, metrics

import sys

import numpy as np

import matplotlib.pyplot as plt
from matplotlib.collections import LineCollection

import pandas as pd

print(__doc__)


# #############################################################################
# Retrieve the data from Internet

# The data is from 2003 - 2008. This is reasonably calm: (not too long ago so
# that we get high-tech firms, and before the 2008 crash). This kind of
# historical data can be obtained for from APIs like the quandl.com and
# alphavantage.co ones.

symbol_dict = {
    'TOT': 'Total',
    'XOM': 'Exxon',
    'CVX': 'Chevron',
    'COP': 'ConocoPhillips',
    'VLO': 'Valero Energy',
    'MSFT': 'Microsoft',
    'IBM': 'IBM',
    'TWX': 'Time Warner',
    'CMCSA': 'Comcast',
    'CVC': 'Cablevision',
    'YHOO': 'Yahoo',
    'DELL': 'Dell',
    'HPQ': 'HP',
    'AMZN': 'Amazon',
    'TM': 'Toyota',
    'CAJ': 'Canon',
    'SNE': 'Sony',
    'F': 'Ford',
    'HMC': 'Honda',
    'NAV': 'Navistar',
    'NOC': 'Northrop Grumman',
    'BA': 'Boeing',
    'KO': 'Coca Cola',
    'MMM': '3M',
    'MCD': 'McDonald\'s',
    'PEP': 'Pepsi',
    'K': 'Kellogg',
    'UN': 'Unilever',
    'MAR': 'Marriott',
    'PG': 'Procter Gamble',
    'CL': 'Colgate-Palmolive',
    'GE': 'General Electrics',
    'WFC': 'Wells Fargo',
    'JPM': 'JPMorgan Chase',
    'AIG': 'AIG',
    'AXP': 'American express',
    'BAC': 'Bank of America',
    'GS': 'Goldman Sachs',
    'AAPL': 'Apple',
    'SAP': 'SAP',
    'CSCO': 'Cisco',
    'TXN': 'Texas Instruments',
    'XRX': 'Xerox',
    'WMT': 'Wal-Mart',
    'HD': 'Home Depot',
    'GSK': 'GlaxoSmithKline',
    'PFE': 'Pfizer',
    'SNY': 'Sanofi-Aventis',
    'NVS': 'Novartis',
    'KMB': 'Kimberly-Clark',
    'R': 'Ryder',
    'GD': 'General Dynamics',
    'RTN': 'Raytheon',
    'CVS': 'CVS',
    'CAT': 'Caterpillar',
    'DD': 'DuPont de Nemours'}


symbols, names = np.array(sorted(symbol_dict.items())).T

quotes = []

for symbol in symbols:
    print('Fetching quote history for %r' % symbol, file=sys.stderr)
    url = ('https://raw.githubusercontent.com/scikit-learn/examples-data/'
           'master/financial-data/{}.csv')
    quotes.append(pd.read_csv(url.format(symbol)))

close_prices = np.vstack([q['close'] for q in quotes])
open_prices = np.vstack([q['open'] for q in quotes])

# The daily variations of the quotes are what carry most information
variation = close_prices - open_prices
Automatically created module for IPython interactive environment
Fetching quote history for 'AAPL'
Fetching quote history for 'AIG'
Fetching quote history for 'AMZN'
Fetching quote history for 'AXP'
Fetching quote history for 'BA'
Fetching quote history for 'BAC'
Fetching quote history for 'CAJ'
Fetching quote history for 'CAT'
Fetching quote history for 'CL'
Fetching quote history for 'CMCSA'
Fetching quote history for 'COP'
Fetching quote history for 'CSCO'
Fetching quote history for 'CVC'
Fetching quote history for 'CVS'
Fetching quote history for 'CVX'
Fetching quote history for 'DD'
Fetching quote history for 'DELL'
Fetching quote history for 'F'
Fetching quote history for 'GD'
Fetching quote history for 'GE'
Fetching quote history for 'GS'
Fetching quote history for 'GSK'
Fetching quote history for 'HD'
Fetching quote history for 'HMC'
Fetching quote history for 'HPQ'
Fetching quote history for 'IBM'
Fetching quote history for 'JPM'
Fetching quote history for 'K'
Fetching quote history for 'KMB'
Fetching quote history for 'KO'
Fetching quote history for 'MAR'
Fetching quote history for 'MCD'
Fetching quote history for 'MMM'
Fetching quote history for 'MSFT'
Fetching quote history for 'NAV'
Fetching quote history for 'NOC'
Fetching quote history for 'NVS'
Fetching quote history for 'PEP'
Fetching quote history for 'PFE'
Fetching quote history for 'PG'
Fetching quote history for 'R'
Fetching quote history for 'RTN'
Fetching quote history for 'SAP'
Fetching quote history for 'SNE'
Fetching quote history for 'SNY'
Fetching quote history for 'TM'
Fetching quote history for 'TOT'
Fetching quote history for 'TWX'
Fetching quote history for 'TXN'
Fetching quote history for 'UN'
Fetching quote history for 'VLO'
Fetching quote history for 'WFC'
Fetching quote history for 'WMT'
Fetching quote history for 'XOM'
Fetching quote history for 'XRX'
Fetching quote history for 'YHOO'
# Was haben wir bekommen?

print(quotes)
[            date    open   close
0     2003-01-02   14.36   14.80
1     2003-01-03   14.80   14.90
2     2003-01-06   15.03   14.90
3     2003-01-07   14.79   14.85
4     2003-01-08   14.58   14.55
...          ...     ...     ...
1253  2007-12-24  195.03  198.80
1254  2007-12-26  199.01  198.95
1255  2007-12-27  198.95  198.57
1256  2007-12-28  200.59  199.83
1257  2007-12-31  199.50  198.08

[1258 rows x 3 columns],             date   open  close
0     2003-01-02  58.10  60.30
1     2003-01-03  60.05  60.12
2     2003-01-06  60.12  62.14
3     2003-01-07  62.14  60.93
4     2003-01-08  60.93  60.17
...          ...    ...    ...
1253  2007-12-24  58.52  59.98
1254  2007-12-26  59.98  59.52
1255  2007-12-27  59.09  58.01
1256  2007-12-28  58.26  57.94
1257  2007-12-31  57.37  58.30

[1258 rows x 3 columns],             date   open  close
0     2003-01-02  19.19  19.57
1     2003-01-03  19.59  20.52
2     2003-01-06  20.40  20.70
3     2003-01-07  20.83  21.55
4     2003-01-08  21.44  21.02
...          ...    ...    ...
1253  2007-12-24  91.05  91.01
1254  2007-12-26  91.48  92.85
1255  2007-12-27  92.67  94.25
1256  2007-12-28  95.27  94.45
1257  2007-12-31  93.81  92.64

[1258 rows x 3 columns],             date   open  close
0     2003-01-02  35.80  36.67
1     2003-01-03  36.69  36.80
2     2003-01-06  36.72  38.09
3     2003-01-07  37.85  37.58
4     2003-01-08  37.59  37.30
...          ...    ...    ...
1253  2007-12-24  52.43  53.24
1254  2007-12-26  52.95  52.90
1255  2007-12-27  52.40  51.10
1256  2007-12-28  51.71  50.84
1257  2007-12-31  50.85  52.02

[1258 rows x 3 columns],             date   open  close
0     2003-01-02  33.00  33.88
1     2003-01-03  34.10  34.18
2     2003-01-06  34.05  34.13
3     2003-01-07  34.12  33.30
4     2003-01-08  33.37  33.50
...          ...    ...    ...
1253  2007-12-24  89.55  90.02
1254  2007-12-26  90.07  90.00
1255  2007-12-27  89.99  88.88
1256  2007-12-28  89.00  88.25
1257  2007-12-31  87.76  87.46

[1258 rows x 3 columns],             date   open  close
0     2003-01-02  69.91  70.68
1     2003-01-03  70.10  70.24
2     2003-01-06  69.65  71.25
3     2003-01-07  71.26  71.36
4     2003-01-08  71.37  71.07
...          ...    ...    ...
1253  2007-12-24  41.73  42.28
1254  2007-12-26  42.08  42.30
1255  2007-12-27  42.00  41.46
1256  2007-12-28  41.70  41.10
1257  2007-12-31  40.91  41.26

[1258 rows x 3 columns],             date   open  close
0     2003-01-02  37.05  37.83
1     2003-01-03  37.83  38.15
2     2003-01-06  38.25  39.13
3     2003-01-07  38.90  38.78
4     2003-01-08  38.25  38.03
...          ...    ...    ...
1253  2007-12-24  46.74  46.97
1254  2007-12-26  47.82  46.92
1255  2007-12-27  46.75  46.43
1256  2007-12-28  46.50  46.24
1257  2007-12-31  45.68  45.83

[1258 rows x 3 columns],             date   open  close
0     2003-01-02  45.95  47.75
1     2003-01-03  47.65  47.43
2     2003-01-06  47.55  48.40
3     2003-01-07  48.40  47.85
4     2003-01-08  47.86  46.40
...          ...    ...    ...
1253  2007-12-24  73.00  72.70
1254  2007-12-26  72.61  73.69
1255  2007-12-27  72.88  72.73
1256  2007-12-28  73.01  73.16
1257  2007-12-31  73.00  72.56

[1258 rows x 3 columns],             date   open  close
0     2003-01-02  52.52  53.80
1     2003-01-03  53.25  53.16
2     2003-01-06  53.16  54.32
3     2003-01-07  54.25  53.58
4     2003-01-08  53.65  53.20
...          ...    ...    ...
1253  2007-12-24  79.00  78.46
1254  2007-12-26  78.33  78.99
1255  2007-12-27  78.66  78.51
1256  2007-12-28  78.19  78.74
1257  2007-12-31  78.43  77.96

[1258 rows x 3 columns],             date   open  close
0     2003-01-02  23.43  24.80
1     2003-01-03  24.63  24.50
2     2003-01-06  24.71  25.97
3     2003-01-07  25.50  25.89
4     2003-01-08  25.72  25.39
...          ...    ...    ...
1253  2007-12-24  18.41  18.30
1254  2007-12-26  18.13  18.53
1255  2007-12-27  18.58  18.43
1256  2007-12-28  18.69  18.40
1257  2007-12-31  18.21  18.26

[1258 rows x 3 columns],             date   open  close
0     2003-01-02  48.80  49.33
1     2003-01-03  49.53  49.40
2     2003-01-06  49.50  50.33
3     2003-01-07  49.85  48.44
4     2003-01-08  48.44  47.59
...          ...    ...    ...
1253  2007-12-24  87.02  87.19
1254  2007-12-26  87.68  88.97
1255  2007-12-27  88.92  88.65
1256  2007-12-28  89.04  89.13
1257  2007-12-31  88.79  88.30

[1258 rows x 3 columns],             date   open    close
0     2003-01-02  13.11  13.6400
1     2003-01-03  13.58  13.9100
2     2003-01-06  14.01  14.2000
3     2003-01-07  14.30  14.6000
4     2003-01-08  14.48  14.4400
...          ...    ...      ...
1253  2007-12-24  28.68  28.7200
1254  2007-12-26  28.65  28.3800
1255  2007-12-27  28.16  27.7900
1256  2007-12-28  27.95  27.5600
1257  2007-12-31  27.25  27.0699

[1258 rows x 3 columns],             date   open  close
0     2003-01-02  16.14  17.71
1     2003-01-03  17.70  17.63
2     2003-01-06  17.65  18.50
3     2003-01-07  18.50  18.61
4     2003-01-08  18.50  17.83
...          ...    ...    ...
1253  2007-12-24  24.41  24.33
1254  2007-12-26  24.13  24.51
1255  2007-12-27  24.50  24.53
1256  2007-12-28  24.63  24.19
1257  2007-12-31  24.33  24.50

[1258 rows x 3 columns],             date   open  close
0     2003-01-02  25.45  25.41
1     2003-01-03  25.50  25.89
2     2003-01-06  25.89  25.62
3     2003-01-07  25.63  24.97
4     2003-01-08  25.02  24.95
...          ...    ...    ...
1253  2007-12-24  39.46  39.93
1254  2007-12-26  39.65  39.80
1255  2007-12-27  39.51  39.66
1256  2007-12-28  39.98  40.00
1257  2007-12-31  39.95  39.75

[1258 rows x 3 columns],             date   open  close
0     2003-01-02  67.20  67.82
1     2003-01-03  67.82  68.34
2     2003-01-06  68.34  69.90
3     2003-01-07  69.75  68.45
4     2003-01-08  68.46  68.05
...          ...    ...    ...
1253  2007-12-24  93.63  94.48
1254  2007-12-26  94.31  94.84
1255  2007-12-27  94.80  93.75
1256  2007-12-28  94.38  94.86
1257  2007-12-31  94.37  93.33

[1258 rows x 3 columns],             date   open  close
0     2003-01-02  42.45  43.44
1     2003-01-03  43.45  43.66
2     2003-01-06  43.40  44.71
3     2003-01-07  44.51  44.58
4     2003-01-08  44.25  43.58
...          ...    ...    ...
1253  2007-12-24  45.41  45.23
1254  2007-12-26  45.03  45.07
1255  2007-12-27  44.79  44.40
1256  2007-12-28  44.60  44.30
1257  2007-12-31  44.02  44.09

[1258 rows x 3 columns],             date   open  close
0     2003-01-02  27.10  27.71
1     2003-01-03  27.61  27.79
2     2003-01-06  27.72  28.35
3     2003-01-07  28.63  28.65
4     2003-01-08  28.35  28.32
...          ...    ...    ...
1253  2007-12-24  24.88  25.15
1254  2007-12-26  24.89  24.99
1255  2007-12-27  24.72  24.93
1256  2007-12-28  25.07  24.95
1257  2007-12-31  24.67  24.51

[1258 rows x 3 columns],             date   open  close
0     2003-01-02   9.50   9.94
1     2003-01-03   9.94   9.94
2     2003-01-06   9.70  10.07
3     2003-01-07  10.07  10.13
4     2003-01-08  10.13  10.01
...          ...    ...    ...
1253  2007-12-24   6.75   6.75
1254  2007-12-26   6.71   6.89
1255  2007-12-27   6.88   6.84
1256  2007-12-28   6.82   6.70
1257  2007-12-31   6.66   6.73

[1258 rows x 3 columns],             date   open  close
0     2003-01-02  79.37  80.90
1     2003-01-03  81.30  81.20
2     2003-01-06  81.35  81.17
3     2003-01-07  81.15  79.85
4     2003-01-08  80.09  79.39
...          ...    ...    ...
1253  2007-12-24  88.95  90.71
1254  2007-12-26  90.77  90.43
1255  2007-12-27  90.07  89.22
1256  2007-12-28  90.07  89.05
1257  2007-12-31  88.58  88.99

[1258 rows x 3 columns],             date   open  close
0     2003-01-02  24.65  25.48
1     2003-01-03  25.35  25.40
2     2003-01-06  25.40  26.05
3     2003-01-07  25.99  25.90
4     2003-01-08  25.85  25.50
...          ...    ...    ...
1253  2007-12-24  37.39  37.53
1254  2007-12-26  37.44  37.55
1255  2007-12-27  37.44  37.19
1256  2007-12-28  37.50  37.34
1257  2007-12-31  37.08  37.07

[1258 rows x 3 columns],             date    open   close
0     2003-01-02   68.10   69.65
1     2003-01-03   69.66   70.38
2     2003-01-06   70.02   73.00
3     2003-01-07   72.10   72.70
4     2003-01-08   72.71   70.92
...          ...     ...     ...
1253  2007-12-24  210.95  214.32
1254  2007-12-26  213.32  216.69
1255  2007-12-27  215.74  211.95
1256  2007-12-28  214.50  211.94
1257  2007-12-31  211.59  215.05

[1258 rows x 3 columns],             date   open  close
0     2003-01-02  37.57  38.51
1     2003-01-03  38.60  38.83
2     2003-01-06  38.28  38.90
3     2003-01-07  38.24  38.51
4     2003-01-08  39.33  39.38
...          ...    ...    ...
1253  2007-12-24  50.71  51.24
1254  2007-12-26  51.10  51.01
1255  2007-12-27  51.60  51.32
1256  2007-12-28  50.78  50.75
1257  2007-12-31  51.00  50.39

[1258 rows x 3 columns],             date   open  close
0     2003-01-02  24.21  24.88
1     2003-01-03  22.52  21.38
2     2003-01-06  21.59  21.82
3     2003-01-07  21.75  21.46
4     2003-01-08  21.42  21.16
...          ...    ...    ...
1253  2007-12-24  26.61  27.01
1254  2007-12-26  26.93  26.99
1255  2007-12-27  26.91  26.77
1256  2007-12-28  26.76  26.68
1257  2007-12-31  26.32  26.94

[1258 rows x 3 columns],             date   open  close
0     2003-01-02  18.15  18.64
1     2003-01-03  18.65  18.69
2     2003-01-06  18.40  18.66
3     2003-01-07  18.20  18.45
4     2003-01-08  18.26  18.14
...          ...    ...    ...
1253  2007-12-24  33.71  33.68
1254  2007-12-26  33.50  33.58
1255  2007-12-27  33.10  33.00
1256  2007-12-28  32.95  33.14
1257  2007-12-31  33.49  33.14

[1258 rows x 3 columns],             date   open  close
0     2003-01-02  17.63  18.20
1     2003-01-03  18.35  18.57
2     2003-01-06  18.95  19.65
3     2003-01-07  19.67  19.95
4     2003-01-08  19.94  19.50
...          ...    ...    ...
1253  2007-12-24  51.98  52.32
1254  2007-12-26  52.10  52.77
1255  2007-12-27  52.15  51.61
1256  2007-12-28  51.53  51.36
1257  2007-12-31  51.29  50.48

[1258 rows x 3 columns],             date    open   close
0     2003-01-02   78.80   80.57
1     2003-01-03   80.70   81.65
2     2003-01-06   81.90   83.59
3     2003-01-07   83.95   86.00
4     2003-01-08   85.55   84.19
...          ...     ...     ...
1253  2007-12-24  111.20  111.65
1254  2007-12-26  111.25  111.56
1255  2007-12-27  110.75  109.60
1256  2007-12-28  110.76  110.09
1257  2007-12-31  109.25  108.10

[1258 rows x 3 columns],             date   open  close
0     2003-01-02  25.25  25.44
1     2003-01-03  25.50  25.94
2     2003-01-06  26.00  27.98
3     2003-01-07  27.98  27.84
4     2003-01-08  27.25  26.77
...          ...    ...    ...
1253  2007-12-24  44.14  44.83
1254  2007-12-26  44.50  44.94
1255  2007-12-27  44.52  43.64
1256  2007-12-28  44.00  43.26
1257  2007-12-31  43.13  43.65

[1258 rows x 3 columns],             date   open  close
0     2003-01-02  34.28  34.87
1     2003-01-03  34.74  34.31
2     2003-01-06  34.47  34.96
3     2003-01-07  35.00  33.85
4     2003-01-08  34.00  33.94
...          ...    ...    ...
1253  2007-12-24  53.65  53.61
1254  2007-12-26  53.51  53.47
1255  2007-12-27  53.40  52.81
1256  2007-12-28  53.02  52.92
1257  2007-12-31  52.74  52.43

[1258 rows x 3 columns],             date   open  close
0     2003-01-02  47.78  47.45
1     2003-01-03  47.45  47.24
2     2003-01-06  47.21  47.74
3     2003-01-07  47.35  47.09
4     2003-01-08  46.95  46.45
...          ...    ...    ...
1253  2007-12-24  69.65  69.83
1254  2007-12-26  69.79  70.09
1255  2007-12-27  69.70  69.50
1256  2007-12-28  70.31  69.94
1257  2007-12-31  69.66  69.34

[1258 rows x 3 columns],             date   open  close
0     2003-01-02  44.15  44.85
1     2003-01-03  44.86  44.74
2     2003-01-06  44.60  44.92
3     2003-01-07  44.50  44.36
4     2003-01-08  44.60  44.07
...          ...    ...    ...
1253  2007-12-24  63.04  63.21
1254  2007-12-26  63.04  63.01
1255  2007-12-27  62.96  62.30
1256  2007-12-28  62.32  62.27
1257  2007-12-31  62.06  61.37

[1258 rows x 3 columns],             date    open  close
0     2003-01-02  33.100  34.03
1     2003-01-03  34.030  34.28
2     2003-01-06  33.710  33.94
3     2003-01-07  33.690  33.93
4     2003-01-08  33.940  33.55
...          ...     ...    ...
1253  2007-12-24  33.750  34.39
1254  2007-12-26  34.210  34.06
1255  2007-12-27  33.745  33.73
1256  2007-12-28  34.220  34.12
1257  2007-12-31  33.950  34.18

[1258 rows x 3 columns],             date   open  close
0     2003-01-02  16.17  16.55
1     2003-01-03  16.50  16.12
2     2003-01-06  16.25  16.65
3     2003-01-07  16.65  16.67
4     2003-01-08  16.53  16.84
...          ...    ...    ...
1253  2007-12-24  60.02  60.31
1254  2007-12-26  60.37  59.88
1255  2007-12-27  59.64  59.19
1256  2007-12-28  59.51  59.50
1257  2007-12-31  59.72  58.91

[1258 rows x 3 columns],             date    open   close
0     2003-01-02  123.30  126.80
1     2003-01-03  126.30  126.30
2     2003-01-06  125.70  127.20
3     2003-01-07  126.30  127.10
4     2003-01-08  126.80  125.70
...          ...     ...     ...
1253  2007-12-24   86.05   86.26
1254  2007-12-26   86.00   86.07
1255  2007-12-27   85.65   85.40
1256  2007-12-28   86.12   85.09
1257  2007-12-31   84.80   84.32

[1258 rows x 3 columns],             date   open  close
0     2003-01-02  52.30  53.72
1     2003-01-03  53.59  53.79
2     2003-01-06  54.02  54.77
3     2003-01-07  54.92  55.80
4     2003-01-08  55.37  54.24
...          ...    ...    ...
1253  2007-12-24  36.13  36.58
1254  2007-12-26  36.41  36.61
1255  2007-12-27  36.35  35.97
1256  2007-12-28  36.10  36.12
1257  2007-12-31  35.90  35.60

[1258 rows x 3 columns],             date   open  close
0     2003-01-02  24.45  25.22
1     2003-01-03  25.19  25.48
2     2003-01-06  25.45  25.96
3     2003-01-07  25.96  26.05
4     2003-01-08  26.05  25.66
...          ...    ...    ...
1253  2007-12-24  54.50  55.90
1254  2007-12-26  55.00  55.85
1255  2007-12-27  55.85  54.80
1256  2007-12-28  54.85  54.70
1257  2007-12-31  54.70  54.20

[1258 rows x 3 columns],             date    open   close
0     2003-01-02   97.01   99.80
1     2003-01-03   99.81   99.40
2     2003-01-06   99.53  100.40
3     2003-01-07  100.40   98.41
4     2003-01-08   98.41   98.24
...          ...     ...     ...
1253  2007-12-24   80.99   81.49
1254  2007-12-26   81.38   80.70
1255  2007-12-27   80.72   79.71
1256  2007-12-28   80.36   79.33
1257  2007-12-31   78.91   78.64

[1258 rows x 3 columns],             date   open  close
0     2003-01-02  36.65  37.10
1     2003-01-03  38.00  38.48
2     2003-01-06  38.48  39.02
3     2003-01-07  38.29  38.23
4     2003-01-08  38.24  38.40
...          ...    ...    ...
1253  2007-12-24  53.91  54.25
1254  2007-12-26  54.35  54.30
1255  2007-12-27  54.65  54.44
1256  2007-12-28  55.11  54.83
1257  2007-12-31  54.75  54.31

[1258 rows x 3 columns],             date   open  close
0     2003-01-02  42.12  43.10
1     2003-01-03  43.29  43.40
2     2003-01-06  43.25  42.96
3     2003-01-07  42.70  42.18
4     2003-01-08  42.46  42.70
...          ...    ...    ...
1253  2007-12-24  77.35  77.71
1254  2007-12-26  77.62  77.28
1255  2007-12-27  77.24  76.70
1256  2007-12-28  77.00  77.03
1257  2007-12-31  76.93  75.90

[1258 rows x 3 columns],             date   open  close
0     2003-01-02  30.74  31.53
1     2003-01-03  31.51  31.78
2     2003-01-06  31.88  32.00
3     2003-01-07  32.00  31.63
4     2003-01-08  31.55  30.90
...          ...    ...    ...
1253  2007-12-24  23.20  23.33
1254  2007-12-26  23.24  23.20
1255  2007-12-27  23.10  22.92
1256  2007-12-28  23.05  22.90
1257  2007-12-31  22.79  22.73

[1258 rows x 3 columns],             date   open  close
0     2003-01-02  86.10  87.81
1     2003-01-03  87.65  86.85
2     2003-01-06  87.10  87.84
3     2003-01-07  87.07  86.49
4     2003-01-08  86.40  85.20
...          ...    ...    ...
1253  2007-12-24  74.35  73.94
1254  2007-12-26  73.90  74.04
1255  2007-12-27  73.91  73.89
1256  2007-12-28  74.06  74.25
1257  2007-12-31  74.25  73.42

[1258 rows x 3 columns],             date   open  close
0     2003-01-02  22.15  22.70
1     2003-01-03  22.48  22.55
2     2003-01-06  22.60  22.97
3     2003-01-07  22.97  22.82
4     2003-01-08  22.82  22.68
...          ...    ...    ...
1253  2007-12-24  47.02  48.44
1254  2007-12-26  48.47  47.98
1255  2007-12-27  47.73  47.22
1256  2007-12-28  47.93  47.51
1257  2007-12-31  47.17  47.01

[1258 rows x 3 columns],             date   open  close
0     2003-01-02  31.10  31.58
1     2003-01-03  31.58  31.60
2     2003-01-06  31.70  31.99
3     2003-01-07  31.99  31.41
4     2003-01-08  31.10  31.52
...          ...    ...    ...
1253  2007-12-24  63.26  62.77
1254  2007-12-26  62.51  62.50
1255  2007-12-27  62.39  61.46
1256  2007-12-28  62.06  61.51
1257  2007-12-31  61.43  60.70

[1258 rows x 3 columns],             date   open  close
0     2003-01-02  20.22  21.16
1     2003-01-03  21.99  22.16
2     2003-01-06  22.24  23.09
3     2003-01-07  23.00  23.25
4     2003-01-08  22.40  22.49
...          ...    ...    ...
1253  2007-12-24  51.43  51.94
1254  2007-12-26  51.92  51.95
1255  2007-12-27  52.20  51.45
1256  2007-12-28  51.86  51.67
1257  2007-12-31  51.41  51.05

[1258 rows x 3 columns],             date   open  close
0     2003-01-02  41.42  42.40
1     2003-01-03  42.17  42.14
2     2003-01-06  42.19  42.79
3     2003-01-07  42.10  41.93
4     2003-01-08  41.63  41.56
...          ...    ...    ...
1253  2007-12-24  54.99  54.64
1254  2007-12-26  55.24  55.95
1255  2007-12-27  55.50  54.75
1256  2007-12-28  55.05  54.30
1257  2007-12-31  54.40  54.30

[1258 rows x 3 columns],             date    open  close
0     2003-01-02  30.050  31.04
1     2003-01-03  30.260  30.25
2     2003-01-06  30.090  30.95
3     2003-01-07  30.040  29.90
4     2003-01-08  29.320  29.08
...          ...     ...    ...
1253  2007-12-24  46.990  46.81
1254  2007-12-26  46.900  46.96
1255  2007-12-27  46.582  46.32
1256  2007-12-28  46.390  46.59
1257  2007-12-31  46.280  45.53

[1258 rows x 3 columns],             date    open   close
0     2003-01-02   53.00   53.81
1     2003-01-03   53.90   54.07
2     2003-01-06   54.60   55.16
3     2003-01-07   54.50   54.43
4     2003-01-08   52.90   52.98
...          ...     ...     ...
1253  2007-12-24  106.98  107.25
1254  2007-12-26  108.23  108.87
1255  2007-12-27  108.01  107.52
1256  2007-12-28  107.25  106.60
1257  2007-12-31  106.50  106.17

[1258 rows x 3 columns],             date   open  close
0     2003-01-02  71.62  72.93
1     2003-01-03  72.12  72.27
2     2003-01-06  72.93  74.90
3     2003-01-07  72.40  71.35
4     2003-01-08  69.51  69.46
...          ...    ...    ...
1253  2007-12-24  80.55  80.93
1254  2007-12-26  81.10  81.84
1255  2007-12-27  82.35  82.08
1256  2007-12-28  83.44  83.71
1257  2007-12-31  82.86  82.60

[1258 rows x 3 columns],             date   open  close
0     2003-01-02  13.15  13.31
1     2003-01-03  13.31  13.60
2     2003-01-06  13.60  14.09
3     2003-01-07  14.00  14.16
4     2003-01-08  14.06  13.88
...          ...    ...    ...
1253  2007-12-24  16.59  16.93
1254  2007-12-26  16.84  16.90
1255  2007-12-27  16.83  16.67
1256  2007-12-28  16.70  16.65
1257  2007-12-31  16.54  16.51

[1258 rows x 3 columns],             date   open  close
0     2003-01-02  15.30  16.04
1     2003-01-03  15.75  16.13
2     2003-01-06  16.28  17.04
3     2003-01-07  17.38  16.50
4     2003-01-08  16.50  16.00
...          ...    ...    ...
1253  2007-12-24  33.78  34.12
1254  2007-12-26  34.01  34.10
1255  2007-12-27  34.10  33.64
1256  2007-12-28  33.65  33.49
1257  2007-12-31  33.35  33.40

[1258 rows x 3 columns],             date   open  close
0     2003-01-02  61.60  61.90
1     2003-01-03  61.18  61.24
2     2003-01-06  61.61  61.53
3     2003-01-07  61.14  60.79
4     2003-01-08  61.20  61.02
...          ...    ...    ...
1253  2007-12-24  36.62  36.64
1254  2007-12-26  36.57  36.79
1255  2007-12-27  37.16  36.90
1256  2007-12-28  37.20  37.13
1257  2007-12-31  37.31  36.46

[1258 rows x 3 columns],             date   open  close
0     2003-01-02  37.04  38.12
1     2003-01-03  38.13  37.57
2     2003-01-06  37.37  37.52
3     2003-01-07  37.46  37.06
4     2003-01-08  36.51  35.52
...          ...    ...    ...
1253  2007-12-24  70.42  70.98
1254  2007-12-26  70.92  70.99
1255  2007-12-27  71.10  70.05
1256  2007-12-28  70.26  70.55
1257  2007-12-31  70.46  70.03

[1258 rows x 3 columns],             date   open  close
0     2003-01-02  47.15  48.57
1     2003-01-03  48.05  47.89
2     2003-01-06  47.80  48.84
3     2003-01-07  48.85  48.54
4     2003-01-08  48.55  47.85
...          ...    ...    ...
1253  2007-12-24  30.45  31.20
1254  2007-12-26  31.09  31.26
1255  2007-12-27  30.82  30.30
1256  2007-12-28  30.52  30.09
1257  2007-12-31  29.88  30.19

[1258 rows x 3 columns],             date   open  close
0     2003-01-02  50.65  51.60
1     2003-01-03  51.61  50.00
2     2003-01-06  50.20  50.19
3     2003-01-07  50.32  50.46
4     2003-01-08  50.40  49.99
...          ...    ...    ...
1253  2007-12-24  48.25  48.74
1254  2007-12-26  48.25  48.38
1255  2007-12-27  48.00  47.77
1256  2007-12-28  47.94  48.08
1257  2007-12-31  47.76  47.53

[1258 rows x 3 columns],             date   open  close
0     2003-01-02  35.00  35.47
1     2003-01-03  35.25  35.50
2     2003-01-06  35.45  36.38
3     2003-01-07  36.05  35.15
4     2003-01-08  35.15  35.00
...          ...    ...    ...
1253  2007-12-24  93.51  93.66
1254  2007-12-26  93.66  94.81
1255  2007-12-27  94.94  93.67
1256  2007-12-28  94.26  95.00
1257  2007-12-31  94.39  93.69

[1258 rows x 3 columns],             date   open  close
0     2003-01-02   8.09   8.16
1     2003-01-03   8.16   8.28
2     2003-01-06   8.23   8.44
3     2003-01-07   8.39   8.31
4     2003-01-08   8.25   8.27
...          ...    ...    ...
1253  2007-12-24  16.49  16.38
1254  2007-12-26  16.25  16.49
1255  2007-12-27  16.33  16.19
1256  2007-12-28  16.21  16.34
1257  2007-12-31  16.32  16.19

[1258 rows x 3 columns],             date   open  close
0     2003-01-02  16.59  17.60
1     2003-01-03  17.50  18.10
2     2003-01-06  17.85  18.94
3     2003-01-07  17.87  19.15
4     2003-01-08  18.88  18.75
...          ...    ...    ...
1253  2007-12-24  24.01  24.05
1254  2007-12-26  23.85  23.96
1255  2007-12-27  23.60  23.71
1256  2007-12-28  23.66  23.45
1257  2007-12-31  23.22  23.26

[1258 rows x 3 columns]]
Ansatz mit kmeans#
Parameter optimieren mit Hilfe von Inertia#
# Anzahl Cluster der Inertia bestimmen

inertia = {}

for i in range(2,26):
    kmeans = cluster.KMeans(n_clusters=i, n_init=10,random_state = 0)
    kmeans.fit(variation)

    inert = kmeans.inertia_
    inertia[i] = inert

    print(i, ": ",inert)

# Verlauf der Inertia plotten
plt.figure()
plt.plot(list(inertia.keys()), list(inertia.values()))
plt.xlabel("Number of clusters")
plt.ylabel("Inertia")
plt.show()
2 : 20531.57220388364
3 : 17807.94624061381
4 : 15455.691159741138
5 : 14559.026032108792
6 : 13940.589884699166
7 : 12869.485803374893
8 : 12069.521818774563
9 : 11322.157530963334
10 : 10539.875246335909
11 : 10171.383181265388
12 : 9272.720047387204
13 : 8613.991266345389
14 : 8245.773753968457
15 : 7608.037276005726
16 : 7435.895040048364
17 : 7039.693608446059
18 : 6823.257908415804
19 : 6293.346231329231
20 : 5828.2618263029035
21 : 5478.662667774222
22 : 4948.978289356456
23 : 4829.475831223448
24 : 4629.946344689167
25 : 4348.679995564138
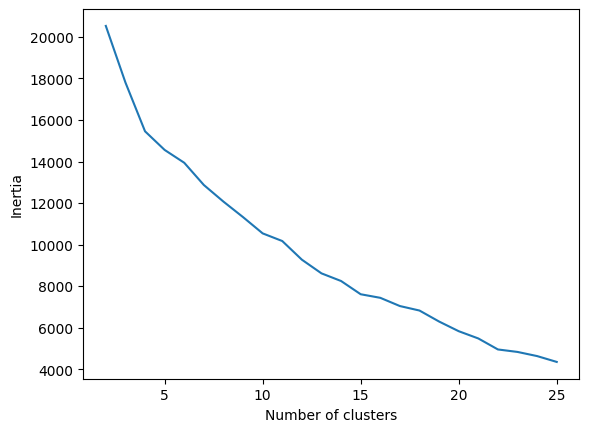
Wir variieren die Anzahl der Cluster und berechnen jeweils die Inertia. Dann suchen wir im Inertia-Plot nach einem “Ellenbogen”, also einer Stelle, an der die Kurve deutlich abknickt. Dies nennt sich die “Elbow Method”, ein einfaches, aber oft hilfreiches Verfahren. Die erwünschte Richtung des Knicks (nach oben oder nach unten) bestimmt sich dadurch, ob größere oder kleinere Werte des Maßes erwünscht sind.
In unserem Fall ist die Kurve sehr glatt, aber es gibt einen Knick bei 4, dann wieder bei 6, 10, 11 und 14, usw.
Da die Kurve keinen eindeutigen Ellenbogen hat, brauchen wir ein zusätzliches Kriterium. Wir wählen die Größe der gefundenen Cluster, da K-Means oft ein riesiges “Restcluster” und dann mehrere kleinere Cluster erzeugt. Wir möchten aber gerade, dass jeweils eine überschaubare Anzahl an Instanzen zusammengefasst wird.
# Anzahl Cluster empirisch bestimmt

num_clust={4, 6,10,11,14}

for i in num_clust:
    print("Clustergrößen für "+str(i)+" Cluster")
    kmeans = cluster.KMeans(n_clusters=i, n_init=10, random_state=0)
    kmeans.fit(variation)

    for j in range(0,i):
        print("Name:", j, "Größe: ", list(kmeans.labels_).count(j))
Clustergrößen für 4 Cluster
Name: 0 Größe:  1
Name: 1 Größe:  49
Name: 2 Größe:  1
Name: 3 Größe:  5
Clustergrößen für 6 Cluster
Name: 0 Größe:  48
Name: 1 Größe:  1
Name: 2 Größe:  2
Name: 3 Größe:  1
Name: 4 Größe:  1
Name: 5 Größe:  3
Clustergrößen für 10 Cluster
Name: 0 Größe:  1
Name: 1 Größe:  44
Name: 2 Größe:  4
Name: 3 Größe:  1
Name: 4 Größe:  1
Name: 5 Größe:  1
Name: 6 Größe:  1
Name: 7 Größe:  1
Name: 8 Größe:  1
Name: 9 Größe:  1
Clustergrößen für 11 Cluster
Name: 0 Größe:  2
Name: 1 Größe:  3
Name: 2 Größe:  1
Name: 3 Größe:  1
Name: 4 Größe:  4
Name: 5 Größe:  1
Name: 6 Größe:  2
Name: 7 Größe:  1
Name: 8 Größe:  1
Name: 9 Größe:  6
Name: 10 Größe:  34
Clustergrößen für 14 Cluster
Name: 0 Größe:  41
Name: 1 Größe:  1
Name: 2 Größe:  1
Name: 3 Größe:  3
Name: 4 Größe:  1
Name: 5 Größe:  1
Name: 6 Größe:  1
Name: 7 Größe:  1
Name: 8 Größe:  1
Name: 9 Größe:  1
Name: 10 Größe:  1
Name: 11 Größe:  1
Name: 12 Größe:  1
Name: 13 Größe:  1
Unsere Evaluation zeigt, dass die meisten Clusterläufe das typische große Restcluster zeigen und ansonsten viele Firmen alleine in einzelne Cluster stecken. Am meisten entsprecht noch der Lauf mit 11 Clustern unseren Wünschen: Es gibt 5 Cluster mit zwei oder mehr Mitgliedern.
Auswertung: Welche Firmen werden zusammen geclustert?#
# Welche Firmen werden zusammengestellt?

kmeans = cluster.KMeans(n_clusters=11, n_init=10, random_state=0)
kmeans.fit(variation)

max_label = kmeans.labels_.max()

# Finde für jedes Clusterlabel die Namen aller Instanzen, die diesem Cluster zugewiesen wurden.
for i in range(max_label + 1):
    print('Cluster %i: %s' % ((i + 1), ', '.join(names[kmeans.labels_ == i])))
Cluster 1: General Dynamics, Northrop Grumman
Cluster 2: Kellogg, Pepsi, Procter Gamble
Cluster 3: Goldman Sachs
Cluster 4: Apple
Cluster 5: ConocoPhillips, Chevron, Total, Exxon
Cluster 6: Caterpillar
Cluster 7: 3M, Navistar
Cluster 8: Valero Energy
Cluster 9: IBM
Cluster 10: AIG, Amazon, American express, Boeing, Ryder, Toyota
Cluster 11: Bank of America, Canon, Colgate-Palmolive, Comcast, Cisco, Cablevision, CVS, DuPont de Nemours, Dell, Ford, General Electrics, GlaxoSmithKline, Home Depot, Honda, HP, JPMorgan Chase, Kimberly-Clark, Coca Cola, Marriott, McDonald's, Microsoft, Novartis, Pfizer, Raytheon, SAP, Sony, Sanofi-Aventis, Time Warner, Texas Instruments, Unilever, Wells Fargo, Wal-Mart, Xerox, Yahoo
Wir lassen jetzt für jedes Cluster die Namen der Mitglieder auflisten. Cluster 11 ist unser Restcluster, das schwer zu interpretieren ist.
Besonders interessant sind Cluster 1, 2, 5, 7 und 10, weil sie Firmen zusammen gruppieren. Die übrigen Cluster enthalten jeweils nur ein Unternehmen; ob diese Unternehmen z.B. Outlier sind oder ob sie nur aufgrund der zufälligen Initialisierung der Cluster-Zentroide in eigenen Clustern liegen, lässt sich anhand der Zuordnung nicht sagen. Dies kann man prüfen, indem man die Daten visualisiert (Suche nach Outliern) oder die Initialisierung variiert.
Die für uns interessanten Cluster sind sinnvoll interpretierbar: Cluster 1 enthält zwei Firmen aus der Rüstungsindustrie. Eigentlich würde auch Raytheon noch in dieses Cluster gehören; diese Firma ist aber im großen Restcluster verblieben.
Cluster 2 enthält zwei Nahrungsmittelhersteller sowie ein Unternehmen, das Hygiene- und Reinigungsartikel herstellt - im groben also alltägliche Waren, die sich im Haushalt finden. Hier fehlen aus einer Vollständigkeitssicht z.B. noch Colgate-Palmolive oder Coca Cola.
In Cluster 5 finden sich Öl-/Energiekonzerne. Cluster 10 ist hingegen sehr gemischt: AIG ist ein Versicherungsunternehmen und gehört mit American express in die Finanzsparte; Boeing baut Flugzeuge und Ryder vermietet und wartet z.B. LKW.
In Summe kann man sagen, dass die Interpretation gefundenere Cluster mit Vorsicht geschehen sollte - wenn wir die Daten bereits gut kennen und wissen, welche Instanzen zusammengehören, stellen wir fest, dass Cluster unvollständig oder nicht sinnvoll sind. Wenn wir also explorativ clustern, sollten wir Hypothesen, die aufgrund der Clusteringergebnisse aufgestellt wurden, sorgfältig an den Daten überprüfen.